EC2 Autoscaling with Custom Metrics
Autoscaling based on message backlog in SQS Queue

I love to grease knots and bolts of SDLC, nurture the underlying infra, rightly automate, monitor systems and enable the dev teams to achieve more with less.
Today you will learn how to define/create/publish the custom metrics and configure target tracking Autoscaling for your EC2 Autoscaling groups based on the metrics. In this blog we will:
Create ASG, SQS Queue, Target Tracking Policy
Use bash scripts to publish/consume messages to/from the SQS Queue
Use bash scripts to publish the custom metrics
Finally, autoscale based on the message count on the queue
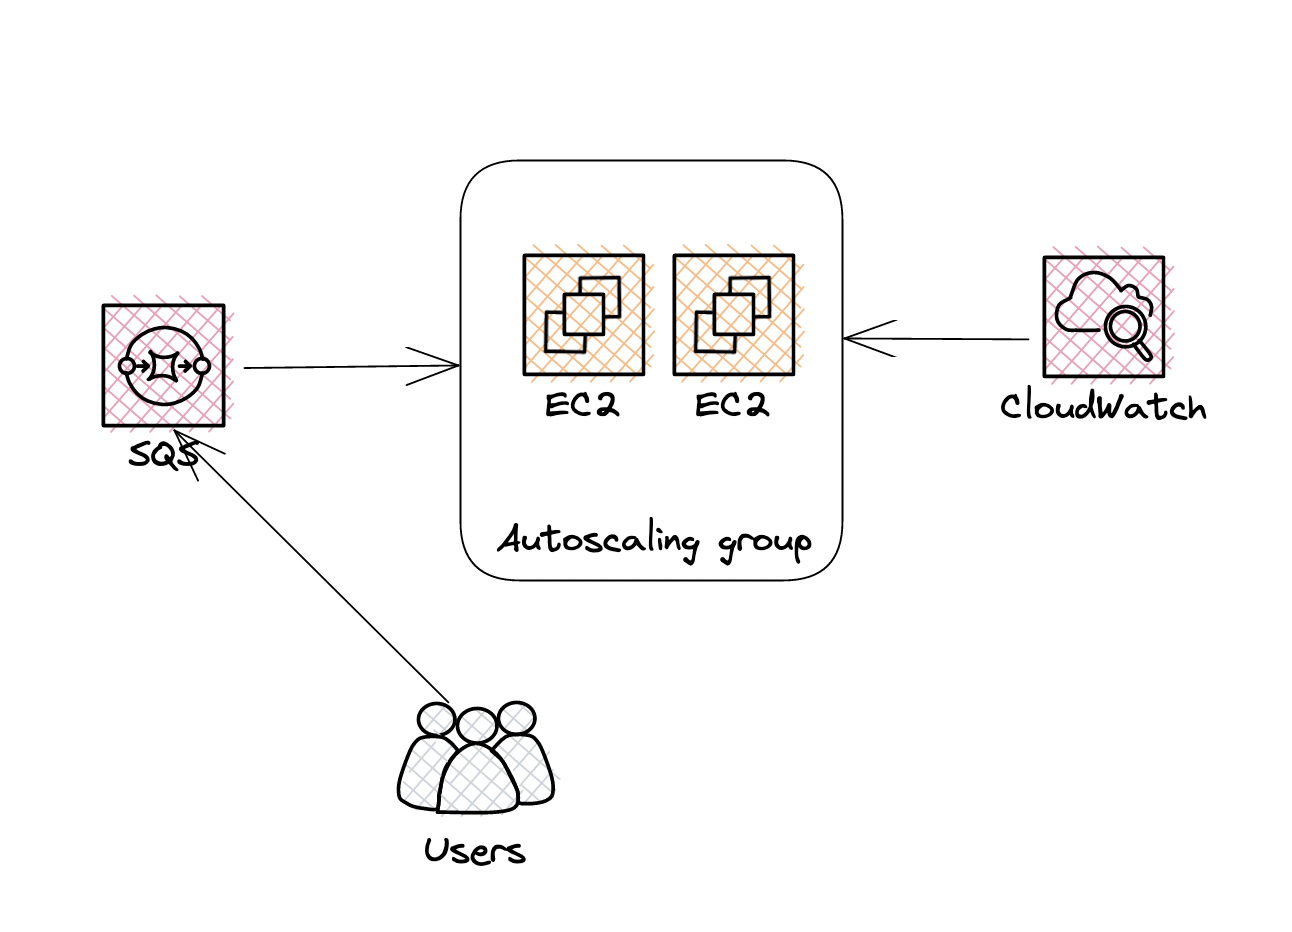
Scenario
Let's suppose a scenario where users publish a data processing request in an AWS SQS. The SLA for the end user is that they should get the results within 2 seconds of the request being sent. Let's suppose each request takes 0.1 seconds to be processed by an EC2 Instance.
Calculation backlog per Instance:
Now let's calculate the message backlog count per instance to determine when to run the autoscaling.
Backlog Per Instance = Time User Can Wait/Time it takes to serve a Request
Backlog Per Instance = 2/0.1 = 20
This means the number of messages in the SQS queue/Instance count shouldn't be greater than 20.
Now we have found Backlog Per Instance=20 as our target for autoscaling. Enough theory now let's get started with creating the necessary setup in the AWS Account.
NOTE: Please be careful with this tutorial as it can add extra costs to your AWS bills
Pre-requisite
EC2 Autoscaling Group
Amazon SQS
Basic Knowledge of AWS CLI and CloudWatch Metrics
Create Autoscaling Group
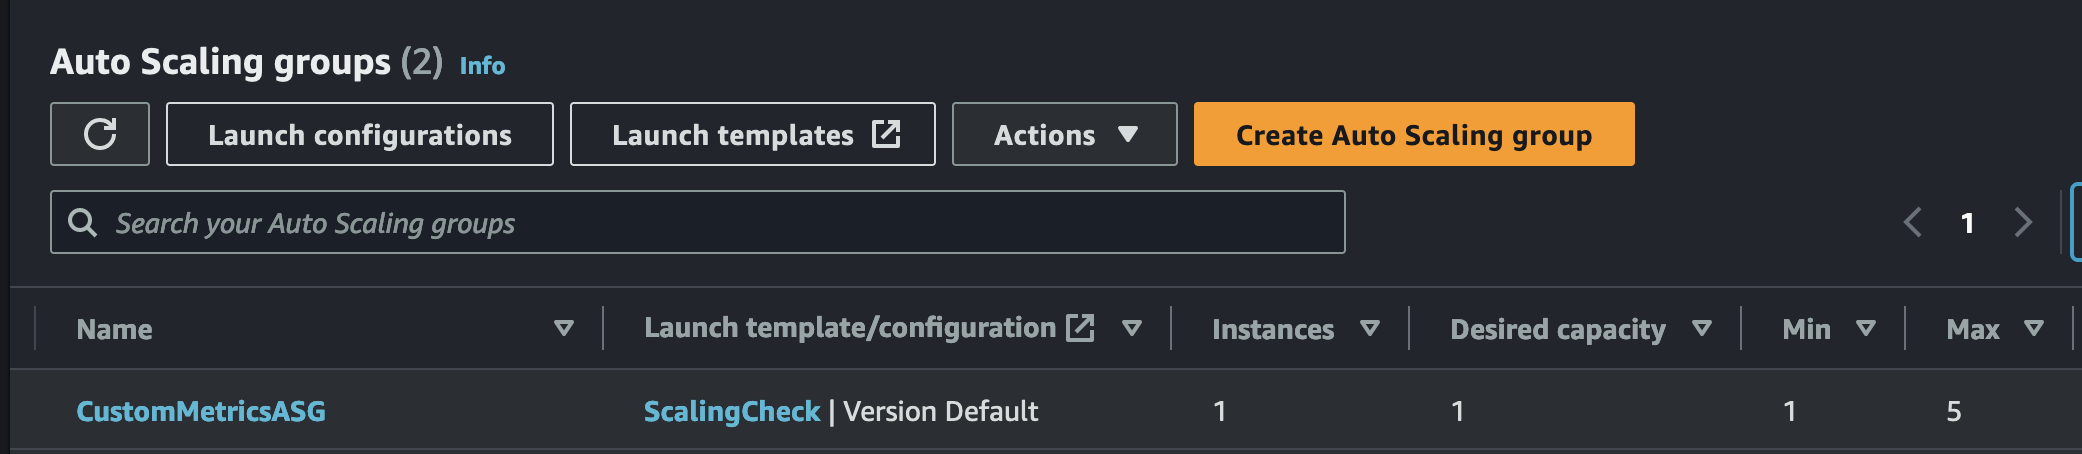
I already have an Autoscaling group with the name CustomMetricsASG and please verify your min/max/desired capacity is properly set to allow the autoscaling to happen.
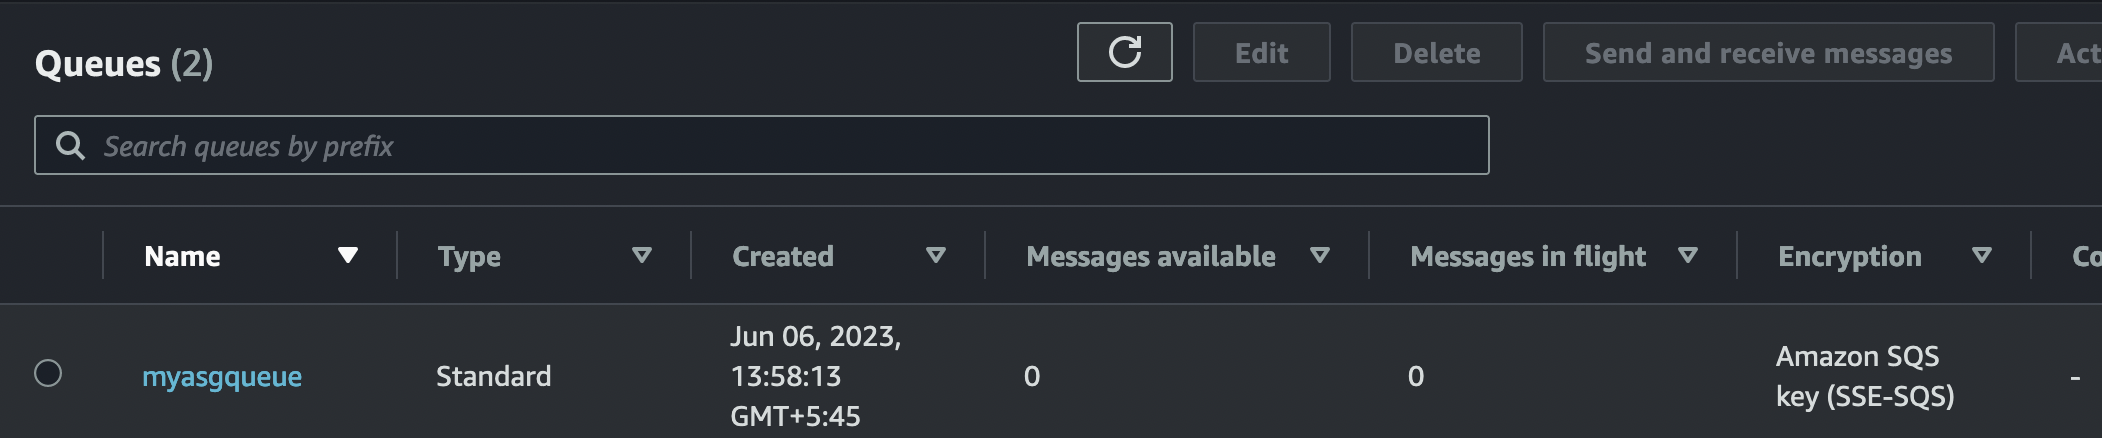
Create Queue
Create a queue using the below command and verify
➜ aws sqs create-queue --queue-name myasgqueue
{
    "QueueUrl": "https://sqs.us-east-1.amazonaws.com/922726392568/myasgqueue"
}
Publish Messages to SQS
Now you can use the below commands to publish the messages in the SQS queue which acts like the requests sent to our system in real-world scenario.
##Producer

##Replace with your queue endpoint
QUEUE_URL=https://sqs.us-east-1.amazonaws.com/922726392568/myasgqueue
while true
do
  echo "Publishing messages..."
  sleep 3
  aws sqs send-message --queue-url ${QUEUE_URL} \
   --message-body "aws asg mock messages to increase the load..." \
   --no-cli-pager
done
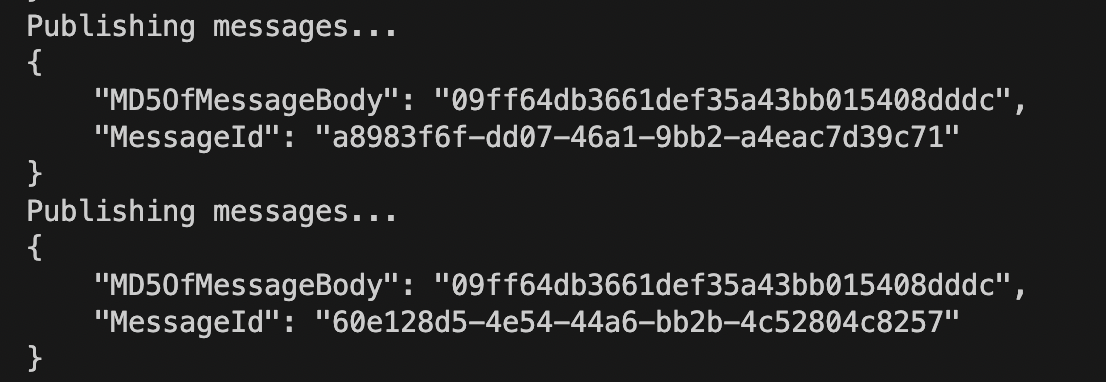
If the above script ran successfully you will see outputs like below:
Consume Messages from SQS(Optional...)
This is optional but if you want to make it more realistic what you can do is increase the sleep time below such that publishing is done fast and the consuming is slower which increases the backlog in the Queue.
## Conumer
##Replace with your queue endpoint
QUEUE_URL=https://sqs.us-east-1.amazonaws.com/922726392568/myasgqueue
while true
do
  echo "consuming messages..."
  sleep 3
  aws sqs receive-message --queue-url ${${QUEUE_URL}} \
  --no-cli-pager
done
Publishing Custom Metrics
The below script does the following things:
Fetches the number of available messages in the SQS Queue
Fetches the number of the EC2 Instances in
InServicestateDivides
Message Count/InstanceCountto get the messageBacklogPerInstanceThen publish the custom metrics every 60 seconds setting:
MetricName:
MyBacklogPerInstanceNamespace:
MyCustomASGMetricsDimension as:
QueueName=${QUEUE_NAME}
NOTE: Before running the script, please replace the values of the below variables.
#!/bin/bash
##Replace these values, before running the script
QUEUE_URL=https://sqs.us-east-1.amazonaws.com/922726392568/myasgqueue
ASG_NAME=CustomMetricsASG
QUEUE_NAME=myasgqueue

while true
do
  echo "....starting...."
  sleep 60
  printf "[INFO] Querying.. Available Queue Message\n"
  APPROX_AVAILABLE_MESSAGES=$(aws sqs get-queue-attributes --queue-url ${QUEUE_URL} --attribute-names ApproximateNumberOfMessages --query Attributes.ApproximateNumberOfMessages --output text | tr -d '[:space:]')
  STATUS_CODE=$?
  if [[ ${STATUS_CODE} -ne 0 ]]
  then
    printf "[WARN] APPROX_AVAILABLE_MESSAGES retrival failed with status code: %s ...\n" ${STATUS_CODE}
    continue
  fi
  printf "[INFO] The Number of Available Message: %s\n" "${APPROX_AVAILABLE_MESSAGES}"

  printf "[INFO] Querying.. Number of Instance in Service\n"
  IN_SERVICE_COUNT=$(aws autoscaling describe-auto-scaling-groups --auto-scaling-group-names ${ASG_NAME} --query "AutoScalingGroups[].Instances[?LifecycleState=='InService'].[InstanceId]"\
    --output text | wc -l | tr -d '[:space:]')
  STATUS_CODE=$?
  if [[ ${STATUS_CODE} -ne 0 ]]
  then
    printf "[WARN] IN_SERVICE_COUNT retrival failed with status code: %s ...\n" ${STATUS_CODE}
    continue
  fi
  printf "[INFO] The Number of Instance in Service: %s\n" "${IN_SERVICE_COUNT}"

  BACKLOG_PER_INSTANCE=$((APPROX_AVAILABLE_MESSAGES / IN_SERVICE_COUNT))
  STATUS_CODE=$?
  if [[ ${STATUS_CODE} -ne 0 ]]
  then
    printf "[WARN] BACKLOG_PER_INSTANCE calculation failed with status code: %s ...\n" ${STATUS_CODE}
    continue
  fi
  printf "[INFO] Calculated Backlog per instance %s/%s: %s\n" "${APPROX_AVAILABLE_MESSAGES}" "${IN_SERVICE_COUNT}" "${BACKLOG_PER_INSTANCE}"

  aws cloudwatch put-metric-data --metric-name MyBacklogPerInstance --namespace MyCustomASGMetrics \
  --unit None --value ${BACKLOG_PER_INSTANCE} --dimensions QueueName=${QUEUE_NAME}
  STATUS_CODE=$?
  if [[ ${STATUS_CODE} -ne 0 ]]
  then
    printf "[WARN] put-metrics-data failed with status code: %s ...\n" ${STATUS_CODE}
    continue
  fi
  printf "[INFO] Successfully published custom metrics with value: %s ...\n" ${BACKLOG_PER_INSTANCE}
done
Once you run the above script, if everything goes fine you should be able to see the custom metrics in the AWS CloudWatch Metrics

Creating TargetTracking Autoscaling
Until now you can't create target tracking autoscaling Policy with custom metrics from AWS Console so, you need to create it from AWS CLI.
Policy Config
Please copy the below config and update with your relevant values:
{
   "TargetValue":20,
   "CustomizedMetricSpecification":{
      "MetricName":"MyBacklogPerInstance",
      "Namespace":"MyCustomASGMetrics",
      "Dimensions":[
         {
            "Name":"QueueName",
            "Value":"myasgqueue"
         }
      ],
      "Statistic":"Average",
      "Unit":"None"
   }
}
Create the Policy
Replace the values in the below variables and run the command
##Replace the below ASG_NAME with your values
ASG_NAME=CustomMetricsASG
aws autoscaling put-scaling-policy --policy-name sqs20-target-tracking-scaling-policy \
  --auto-scaling-group-name ${ASG_NAME} --policy-type TargetTrackingScaling \
  --target-tracking-configuration file://config.json
Once created successfully you will be able to see it in the Autoscaling section of the ASG
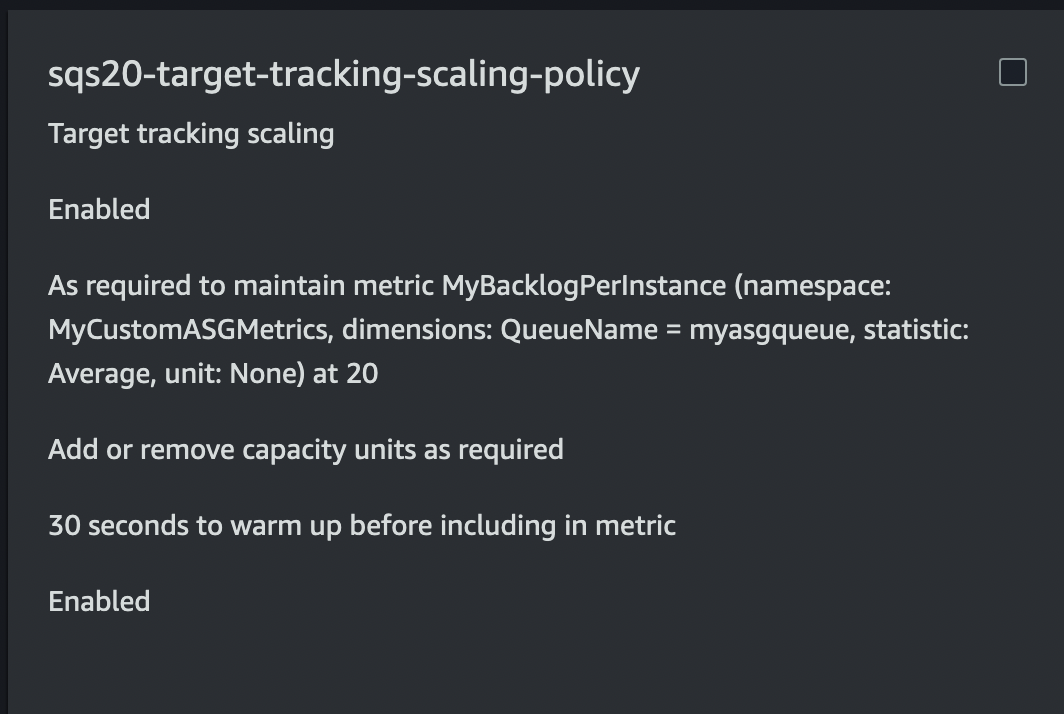
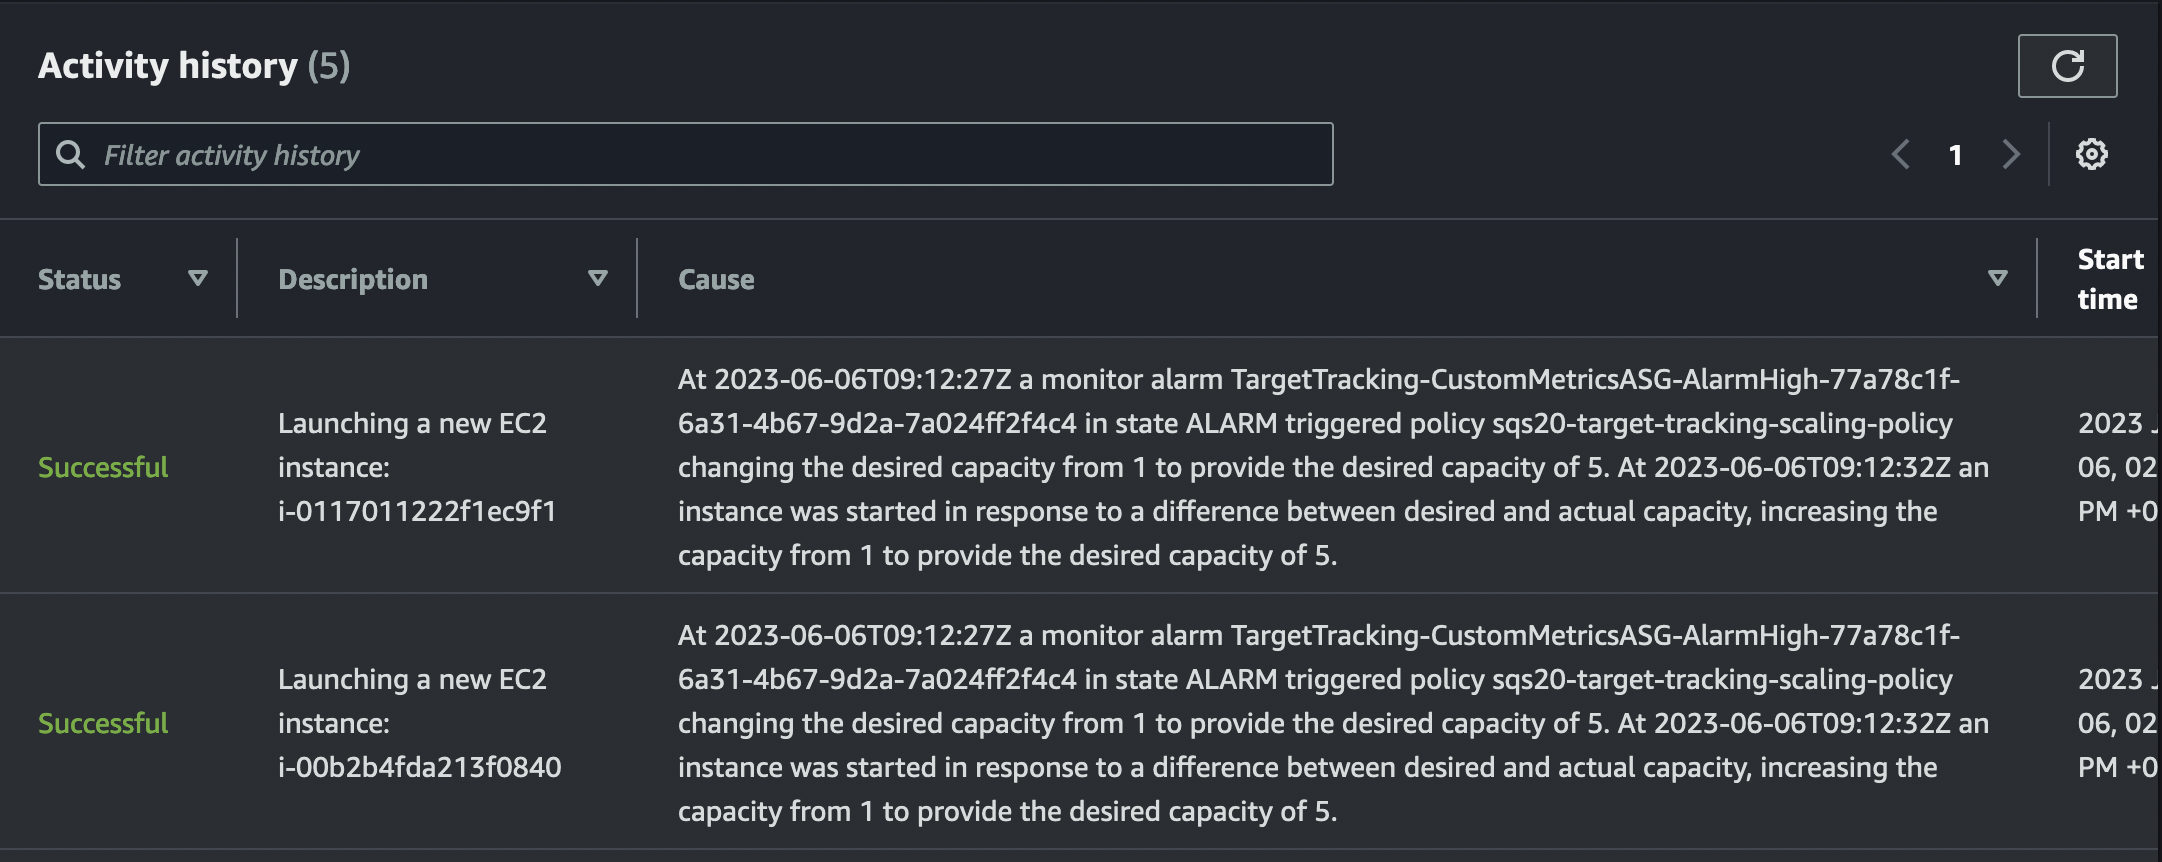
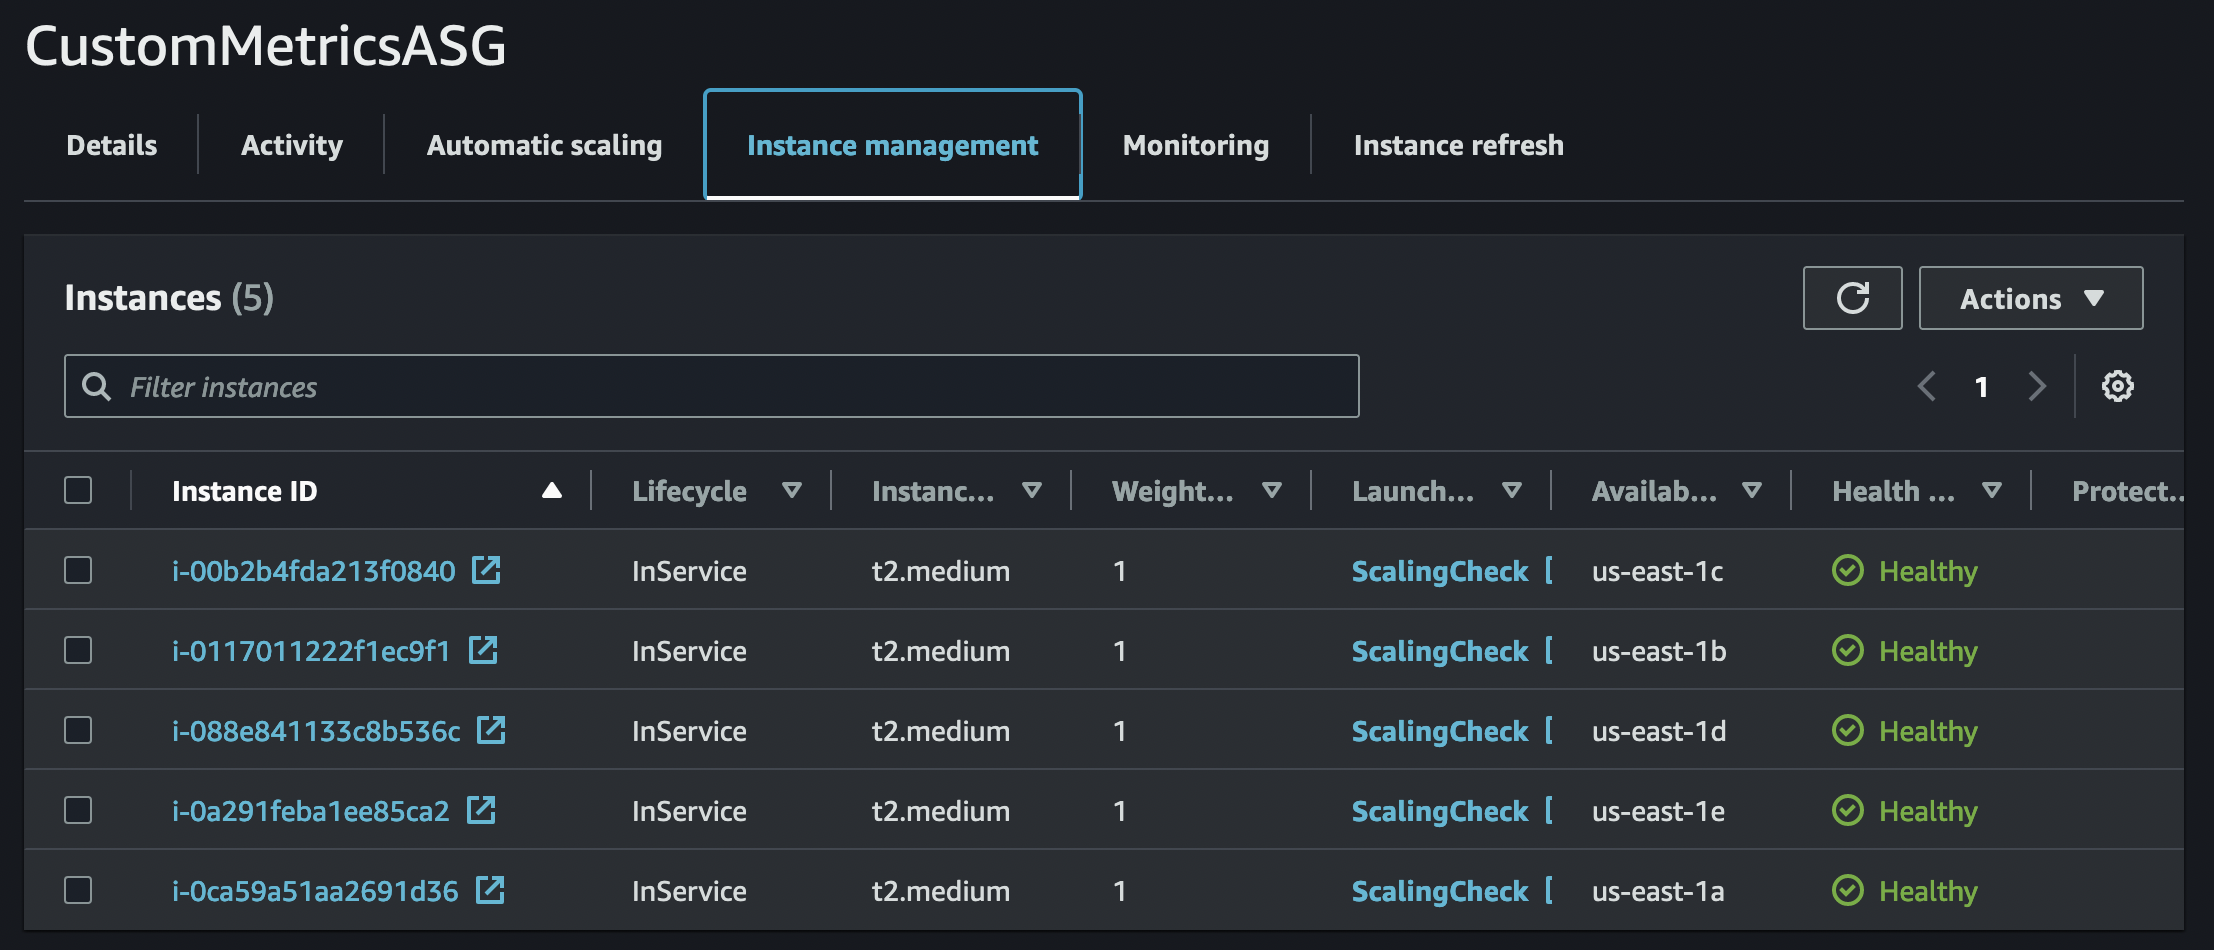
Scaling in Action
If there are enough points in the custom metrics and the value is greater than the defined threshold you will quickly see the scaling happening in the action.
Checking Activity in ASG
Conclusion
This is how you can setup autoscaling for any custom metrics and with any other autoscaling policies. You can even mix it with other autoscaling policies like: simple, step autoscaling.
Thanks for reading! Catch you next time!